Pizza Menu Price Testing: Size, Toppings, and Combo Elasticity
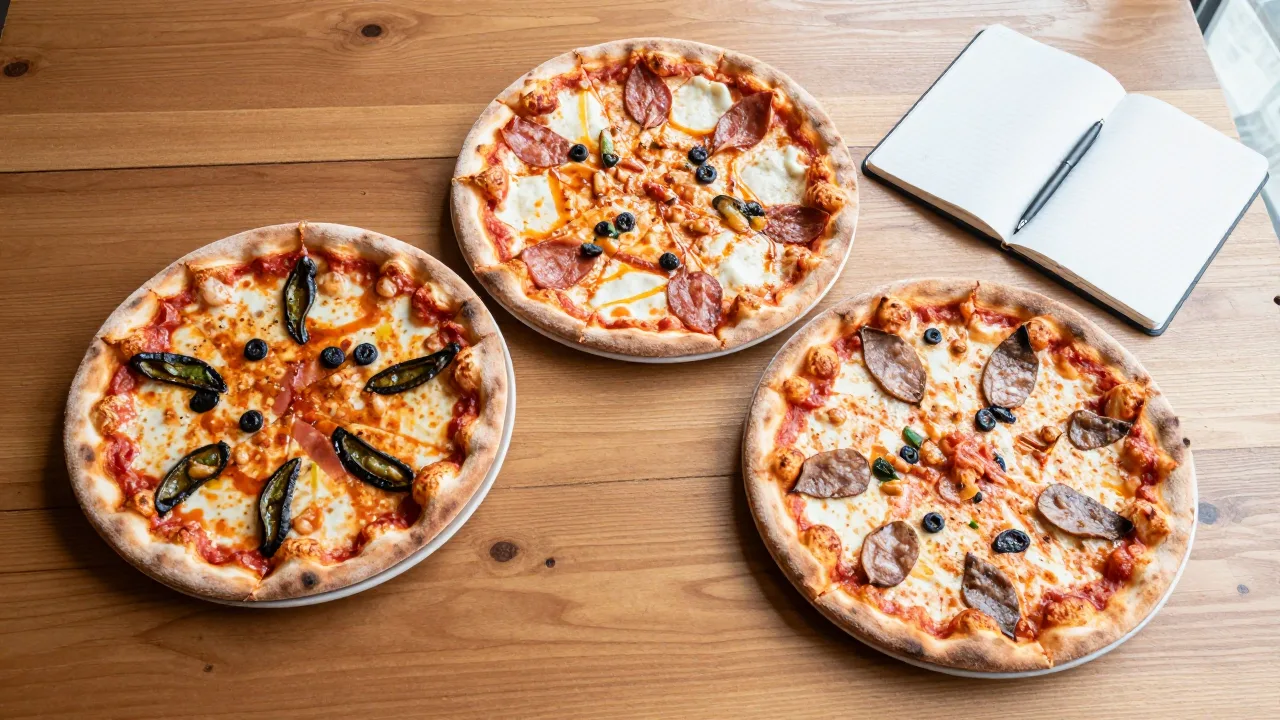
Two shops in the same suburb raised prices in the same month. Shop A added $1.00 to every pizza on the board. Shop B left the large cheese alone, added $0.50 to each specialty pie, and moved per-topping from $1.75 to $2.25. Ninety days later, Shop A's pizza revenue was up 4.1% and its unit count was down 8%. Shop B's revenue was up 5.8% with units down 1.2%.
Same market, same cost pressure, roughly the same percentage increase in average check. One of them made money. The other made less pizza for more dollars and started the slow slide of losing its regulars to the place across the street.
The problem is that most pizzerias price by dread, not by data. Cheese goes up, the owner stares at the menu for a week, and then applies a uniform increase because it feels fair and because deciding item by item requires information nobody has assembled.
Why Uniform Increases Cost You Money
Here's what makes across-the-board pricing so quietly destructive: your customers do not price-check your menu evenly. They price-check exactly one or two things.
For almost every pizzeria in America, the reference item is the plain large cheese. It's the item people quote to each other, the one they compare against the chain's app, the one that anchors whether you feel expensive. A dollar on that pie is highly visible. A dollar on your Buffalo chicken specialty is not, because almost nobody has a mental price for a Buffalo chicken specialty.
The same asymmetry runs through the rest of the board. Per-topping charges are compared rarely. Upgrades — extra cheese, stuffed crust, gluten-free base — are compared almost never, because the customer has already decided to buy and is now customizing. Sides and drinks are compared occasionally. Combos are compared as a bundle, which is precisely why bundles are useful.
Now the arithmetic. Suppose your large cheese runs $17.00 with $4.20 in ingredient cost, and you sell 190 a week. Contribution is $12.80 × 190 = $2,432. Raise it to $18.00 and lose 8% of units: $13.80 × 175 = $2,415. You did more work, made fewer pies, occupied more oven time, and ended up $17 behind. Meanwhile the same $1.00 on a specialty pie that loses only 1% of units is nearly pure gain.
That's the entire argument for testing. Not that prices shouldn't rise — costs are real and margins are thin — but that which prices rise is worth several thousand dollars a year and takes about an hour a month to figure out.
What a Real Test Looks Like
You don't need a statistics degree. You need discipline about four things.
One variable at a time
Change one price, or one tightly related group of prices, per test. If you move the large cheese, the topping charge, and the combo price in the same week, you will get a result you cannot attribute to anything. Sequence them instead: sizes this month, toppings next month, combos after that.
Whole weeks, always
Pizza demand is aggressively day-of-week patterned — a Friday can be triple a Tuesday. Any test window that doesn't contain equal numbers of each weekday is comparing apples to a different apple. Start on a Monday, end on a Sunday, run three weeks minimum.
A matched baseline, not last month
Compare your three test weeks to the three weeks immediately before, and then sanity-check against the same three weeks last year if you have the data. This catches seasonality that would otherwise fool you: a price cut in early September will always look brilliant against late August in a college town, and always look terrible against it in a beach town.
Enough units to see through the noise
Weekly item volume under about 30 units means normal variation will swamp a 3% effect. As a working rule, you want 300+ units of the tested item across the whole test window before you trust a small movement. Under that, either test a higher-volume item or extend to six weeks.
And keep a written log — date, item, old price, new price, everything else that happened that week. Six months later you will not remember that the second test week overlapped a school break, and that detail is the difference between a real finding and a wrong one.
The Three Tests Worth Running First
Test 1: The size ladder
Your size ladder is a persuasion device, not just a price list. The gap between medium and large determines how many customers trade up, and most pizzerias have never deliberately set it.
| Structure | 12″ medium | 14″ large | Gap | Typical effect |
|---|---|---|---|---|
| Flat ladder | $15.00 | $17.00 | $2.00 | Strong upsell to large; margin per pie thin on large |
| Standard | $15.00 | $18.00 | $3.00 | Balanced; most common |
| Steep ladder | $15.00 | $20.00 | $5.00 | Medium becomes the volume seller; large becomes premium |
The insight most operators miss: your ingredient cost gap between a 12″ and a 14″ is usually only $1.20 to $1.80 — dough and cheese scale by area, not by menu tier. So a customer who trades up from medium to large at a $2.00 gap hands you roughly $0.40 of extra contribution and takes barely more oven time. Narrowing the gap can be more profitable than widening it, which is the opposite of most owners' instinct. Test it: three weeks at your current gap, three weeks at a gap $1.00 narrower, and watch the size mix as well as the totals.
Test 2: Per-topping charges
Toppings are the highest-margin line on a pizza menu and the least price-checked. A topping that costs you $0.35 to $0.65 in food is commonly sold at $1.75 to $2.75. If you haven't touched this number in two years, it is almost certainly the safest increase on your board.
Two structures worth testing against each other. Flat per-topping pricing is simple and fast to ring in but overcharges for cheap toppings and undercharges for meat. Tiered pricing — veg at one price, meat and premium at another — captures more margin but adds friction on the phone. Run each for three weeks and compare not just contribution but average toppings per pizza; if tiering drops attach rate from 2.1 toppings to 1.7, the extra per-topping revenue may not survive it. This is also where prompted upsells at the register earn their keep, since a suggested third topping is worth more than most discounts.
Test 3: Combo elasticity
A combo is a price test with the comparison built in. When you offer a large one-topping plus knots plus a 2-liter for $26.99 against $30.75 à la carte, you're not discounting — you're buying incremental units and a higher-margin attach.
Judge combos on three numbers together: combo units sold, contribution per combo, and — critically — whether combo sales cannibalized full-price pizza sales or added to them. If your pizza units are flat and combos are up, you just gave a discount to people who were buying anyway. If total units rose, the combo is working. Your POS reporting should let you see both series side by side; if it can't, that's a tooling problem worth solving before you run the test.
Confounds That Will Fool You
Every operator who runs their first test hits at least one of these. Worth knowing them in advance:
- Promotions running concurrently. A BOGO in week two invalidates the whole window. Freeze promos during a test.
- Weather. Three rainy Fridays lift delivery and depress dine-in. Note the weather in your log; it explains more variance than most people expect.
- Local events. Homecoming, a festival, a road closure on your block. All of these move volume more than a $0.50 price change does.
- Marketplace menu drift. If your third-party menus didn't update with your test price, half your channel is running the control.
- Staff explaining the increase. A phone staffer apologizing for new prices creates a real effect you didn't intend to test. Brief the crew to state prices neutrally.
- Reading revenue instead of contribution. The most common error of all. Revenue up with units down can easily mean money down.
Before running any of this, make sure your ingredient costs are current — a test judged on contribution is only as good as the cost side of the equation. Rebuilding item costs is quick with a menu price calculator that works backward from target food-cost percentage, and the broader framework for structuring a menu around margin is covered in this guide to restaurant menu pricing strategy.
Real Numbers: Holding the Anchor, Moving Everything Else
Illustrative scenario — a composite example built to show how the numbers work. It does not describe a real business or customer.
A two-location pizzeria in western Michigan faced a 19% cheese cost increase over eight months and needed roughly 6% more revenue from the pizza category. Instead of a uniform increase, the owner ran three sequential tests across eleven weeks, one variable each, whole weeks, judged on contribution:
- Test 1 — Large cheese $17.50 → $18.50: units −7.4%, contribution −$91/week. Reverted.
- Test 2 — Specialty pies +$1.00 each: units −0.9%, contribution +$318/week. Kept.
- Test 3 — Per topping $1.75 → $2.25: attach rate 2.2 → 2.1 toppings, contribution +$247/week. Kept.
- Net result: +$565/week contribution, about $29,400 annualized, with the reference price unchanged
- Total pizza units: −1.1% over the eleven weeks — effectively flat
The owner's read: "The one increase everybody would have told me to take was the only one that lost money. I'd have taken it and never known."
Your First Ninety Days of Testing
- Week 0 — Update your ingredient costs. Every conclusion depends on this. Pull current invoice pricing for cheese, flour, sauce, and your top six toppings.
- Week 0 — Pick your reference item and leave it alone. For most shops that's the large cheese. Write down that you're not touching it.
- Weeks 1–3 — Run test one on specialty pies. Highest expected gain, lowest visibility. Freeze promos. Log everything.
- Week 4 — Read contribution, not revenue. (Price − cost) × units, test window versus the three weeks prior. Decide keep or revert, and write down which.
- Weeks 5–7 — Run test two on per-topping pricing. Track attach rate alongside contribution.
- Week 8 — Read and decide. Same discipline.
- Weeks 9–11 — Run test three on your size ladder or a combo. Watch mix shift, not just totals.
- Week 12 — Write the summary. Three tests, three decisions, one page. This becomes the baseline you test against next time — and the reason you never have to guess again.
One habit that separates operators who get good at this from those who don't: revert without ego. A reverted price is not a failed test, it's a $91-a-week loss you found in three weeks instead of eating for two years. The shops that end up with genuinely well-priced menus are the ones that ran six tests and reverted two of them.
And pair this with the classification work — knowing which items are your stars, plowhorses, puzzles, and dogs tells you where to point a test in the first place. Our primers on pizza POS menu engineering and what menu engineering actually means cover that framework, and once you've costed a slice properly with the cost-per-slice math, the testing itself is mostly patience.
Frequently Asked Questions
What is price elasticity for a pizzeria menu?
Elasticity measures how much unit sales move when price moves. If you raise a large cheese pizza 6 percent and units fall 3 percent, elasticity is about -0.5, which means demand is inelastic and the increase made you money. If units fall 9 percent, elasticity is -1.5 and you just lost revenue by raising the price. Pizzerias almost never have a single elasticity number — it differs sharply by size, by topping, by day of week, and by whether the item is the one customers use to compare you to the shop down the street.
How long should a menu price test run?
Run at least three full weeks, and always in whole weeks. Pizza demand is strongly day-of-week patterned, so a test that starts on a Wednesday and ends on a Monday compares an unequal mix of days and will mislead you. Three weeks also gets most independents past the 300-to-400 unit threshold where a few percentage points of movement stop being noise. If your volume on the tested item is under about 30 units a week, extend to six weeks or test a higher-volume item instead.
Which pizza items are safest to raise prices on?
Items customers cannot easily price-compare: specialty and signature pies, per-topping charges, upgrades like stuffed crust or extra cheese, and sides such as garlic knots or wings. The riskiest item is your plain large cheese, which functions as the reference price that customers actually remember and use to judge whether you are expensive. A common strategy is to hold the reference item steady and take increases on the surrounding items, where sensitivity is measurably lower.
Should online prices be higher than in-store prices?
Some operators do add a modest premium on third-party marketplace menus to offset commissions of 15 to 30 percent, and marketplaces generally permit it while your own website and phone orders stay at menu price. Charging more on your own online channel than in your dining room is a different question and tends to backfire, because customers notice and it reads as a penalty for the channel you most want them to use. Whatever you decide, keep the pricing consistent enough that a customer never feels tricked comparing a receipt to a menu.
What metric tells me a price test worked?
Total contribution dollars, not revenue and not food-cost percentage. Contribution equals (price minus ingredient cost) times units sold. A price increase that lifts revenue while cutting units can still leave you with less money and more work; a price cut that grows units enough can leave you with more. Calculate contribution for the test period and the matched baseline period, compare the two numbers, and let that comparison — not the sales total on the dashboard — decide whether the new price stays.
Price With Data, Not Dread
KwickOS tracks units and contribution per item, keeps recipe costs current as invoices change, and lets you schedule a price change and compare matched periods side by side. Use KwickOS to find out which increases actually earn money.
Get Started Free →